
The Gen AI ROI Crisis: What the 95% Failure Claim Really Means
Generative AI has an accounting problem.
A 2026 study of nearly 6,000 senior executives found that 69% of firms actively use AI, yet nine in ten reported no impact on employment or productivity over the previous three years. Among 4,454 CEOs surveyed by PwC, only 12% reported both lower costs and higher revenue from AI.
At the same time, field experiments have measured task gains of 14% to 26%. One startup experiment even found higher customer acquisition and revenue. Another study found experienced open-source developers were 19% slower with AI—while believing they were faster.
These findings are not contradictory. They measure different links in the same value chain.
A faster task is not automatically a faster workflow. A faster workflow is not automatically a financial return.
The real crisis is not that “95% of AI fails.” It is that adoption is spreading faster than the management capability required to turn technical capability into attributable business performance.
Evidence reviewed through July 27, 2026.
Contents
The Five-Minute Brief
If you are deciding whether to fund, scale, or stop an AI initiative, start here:
| What the evidence says | What it means for your decision |
|---|---|
| The viral 95% failure statistic comes from preliminary mixed-method research, not audited company returns. | Treat it as a warning about implementation—not a universal base rate. |
| Large 2026 surveys find broad adoption but limited firm-level impact. | “We use AI” is an activity metric, not an investment result. |
| Controlled studies show real gains in bounded tasks, with large differences by worker and context. | Test the exact workflow; do not import a benchmark from a different job. |
| Deep value appears concentrated among roughly 6% to 12% of firms in major surveys. | The upside exists, but complementary capabilities determine who captures it. |
| Saved time often remains capacity rather than cash. | Name the mechanism: avoid cost, serve demand, improve margin, or reduce expected loss. |
| Production cost includes integration, review, governance, failure recovery, and change—not just tokens. | Measure cost per accepted outcome, including human recovery. |
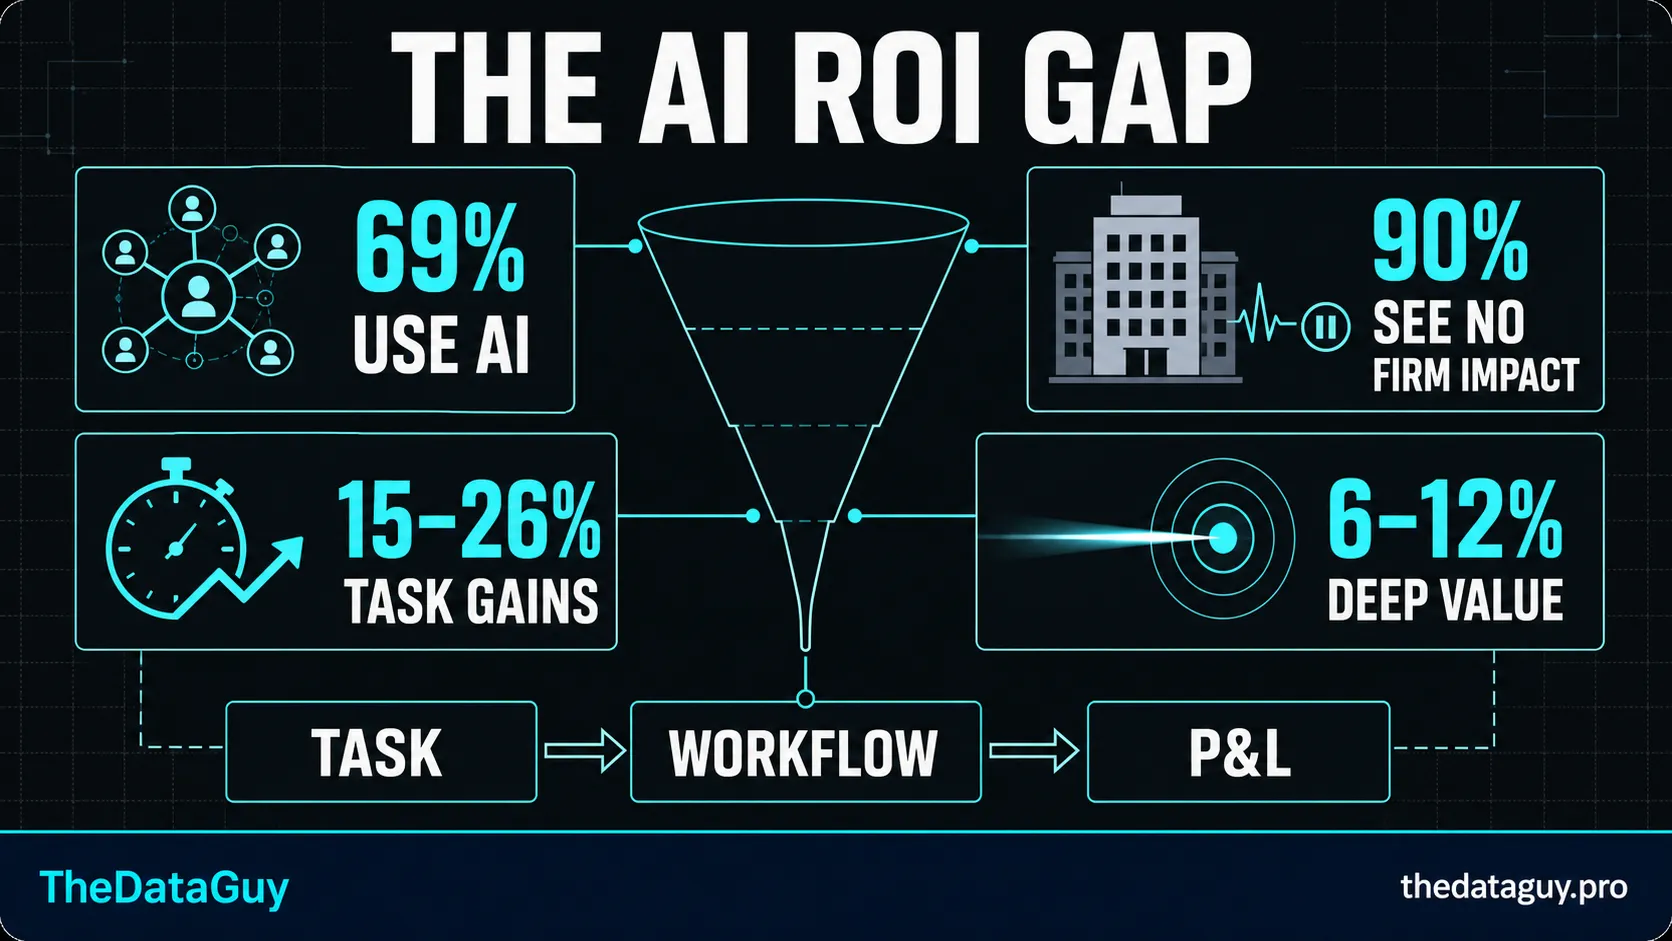
Evidence map: 69% adoption and nine-in-ten impact figures come from the 2026 NBER firm survey. The 14–26% range summarizes two workplace studies. “6–12% deep value” combines McKinsey's share of AI high performers with PwC's share reporting both cost and revenue benefits; these are different measures, not one pooled estimate.
What the “95% Failure” Claim Really Measures
The most dramatic headline comes from Project NANDA's 2025 working report, The GenAI Divide. It says 95% of organizations in its research were getting “zero return” from enterprise Gen AI implementations.
The report is useful, but the precision of the headline exceeds the precision of the evidence.
It labels its results preliminary and combines more than 300 publicly disclosed initiatives, interviews with representatives from 52 organizations, and 153 survey responses gathered at four conferences. Its implementation assessments are directional, definitions of success vary, and it does not publish company-level financial calculations, a common ROI formula, or a confidence interval for the 95% estimate.
So the responsible interpretation is narrower:
Many task-specific enterprise Gen AI deployments struggle to produce sustained operational or financial value. The study does not establish that exactly 95% of all AI projects fail.
That distinction also explains an apparently opposite result. In the Wharton–GBK 2025 survey, 74% of 801 U.S. enterprise decision-makers characterized their ROI as positive. But they were reporting an assessment based on internal conversations, not audited returns. Senior respondents were also more positive than managers and directors.
Project NANDA and Wharton are not two clean measurements of the same thing. One applies a directional implementation test; the other captures executive perception. A universal “AI success rate” cannot be calculated from either.
The “95%” figure is a warning signal from preliminary research—not an audited, market-wide failure rate.
What the Best Current Evidence Says
The 2026 evidence is more informative because it triangulates firm surveys, financial proxies, workplace behavior, and public-company data.
| Evidence | Signal | Boundary |
|---|---|---|
| NBER firm survey, nearly 6,000 executives in four countries | 69% of firms actively use AI; nine in ten saw no employment or productivity impact over three years | Executive-reported firm effects; covers AI broadly |
| PwC CEO survey, 4,454 CEOs in 95 markets | 56% saw no significant cost or revenue benefit; 12% saw both | Perceived benefit, not audited attribution |
| McKinsey, 1,993 respondents | 39% reported any EBIT impact; about 6% were AI high performers | Self-reported and observational |
| Atlanta Fed, 748 financial executives | Perceived productivity exceeded revenue-implied gains; estimated 2025 productivity effects were roughly 0.4%–0.8% | Short-run estimates during early diffusion |
| BCG outside-in analysis, 600+ large U.S. public firms | 6% were adoption leaders; they had industry-adjusted three-year shareholder returns 9.3 points above the median | Association, not proof AI caused performance |
| S&P 500 preprint, 500 public firms | 11% were deeply integrated; profitability was J-shaped, with no productivity or capex difference | Disclosure-based measure; preprint; not causal |
One boundary matters throughout: the large firm and CEO surveys generally measure AI overall, while several implementation reports and workplace studies focus on generative AI. Broader AI evidence informs enterprise capability and investment, but it is not a clean Gen AI ROI estimate.
Taken together, the studies support three conclusions:
- Adoption is broad but often shallow.
- Scaled financial impact is uncommon and concentrated.
- Observational data cannot yet isolate how much of leaders' performance was caused by AI rather than better management, products, capital, or digital foundations.
The latest trend surveys reinforce the same gap. Gallup's July 2026 analysis found that 65% of workers at AI-adopting organizations believed AI improved their productivity, but only 12% strongly agreed it had transformed how work gets done. A July BCG CEO survey reported benefits in targeted areas at nearly nine in ten firms, while only 14% clearly defined P&L impact for every initiative and 26% embedded AI in broader transformation. BCG's public article does not disclose sample size or field dates, so those figures are sentiment signals, not market estimates.
Why Strong Task Results and Weak Firm Results Coexist
The most credible evidence of Gen AI productivity comes from studies that observe work rather than ask people whether they feel productive.
| Study | Measured result | Do not overgeneralize it to… |
|---|---|---|
| Generative AI at Work, 5,172 support agents | Issues resolved per hour rose about 14%; newer and lower-skilled workers gained more | Every occupation or direct profit |
| Three developer experiments, 4,867 developers | Pooled completed tasks rose 26.08% | Software quality or enterprise ROI |
| Shifting Work Patterns, 7,137 workers at 66 firms | Active users spent about two fewer hours on email per week | Broad changes in task mix, which the study did not detect |
| METR developer experiment, 16 experts and 246 tasks | AI increased completion time 19% | All developers; the sample was small and specialized |
| Mapping AI into Production, 515 startups | Broader use-case mapping produced 44% more use cases, 12% more completed tasks, and 1.9× revenue | Mature enterprises; it is a short working paper and gains were concentrated |
The studies reveal heterogeneous treatment effects, not a stable productivity constant. AI tends to perform better when work is frequent, digital, observable, quickly verifiable, and supported by relevant context. It can perform worse when the work relies on tacit knowledge, evaluation is slow, errors are expensive, or experts must repeatedly reconstruct context.
Then comes the aggregation problem.
A July 2026 preprint, AI Writes Faster Than Humans Can Review, followed 802 developers and 196,212 pull requests at one AI-forward company. Merged pull requests per developer eventually reached 2.09 times the pre-mandate baseline—but review load roughly doubled too. The observational design cannot prove causation, but it makes the bottleneck visible: generation accelerated and work moved downstream.
AI creates enterprise value when it improves the binding constraint—not when it makes every task look faster.
That is why a local gain can disappear at firm level. Faster drafting adds little if legal review is the constraint. More marketing content adds little when demand is fixed. More code can reduce performance if review, security, or integration absorbs the gain.
The Value Chain Most Business Cases Skip
AI value has five levels:
| Level | The honest claim |
|---|---|
| 1. Activity | People used the tool. |
| 2. Technical quality | The system met an accuracy, latency, or safety threshold. |
| 3. Workflow performance | Cycle time, throughput, quality, or escalation improved. |
| 4. Economic value | Cost per case, contribution margin, cash timing, or expected loss moved. |
| 5. Realized return | Attributable value exceeded total production cost. |
Every level is useful. The mistake is presenting one as proof of the next.
The equation is simple:
The difficult words are realized and total.
Saved Time Is Not Automatically Money
Time saved can become value in only a few ways:
- Save: avoid hiring, contractor spend, rework, claims, penalties, or structural cost.
- Scale: serve additional demand with the same workforce and earn contribution margin.
- Innovate: create a new product, service, or decision capability with a staged investment case.
If none occurs, the result is capacity. Capacity may improve service or employee experience, but finance should not call it cash.
Separate cash-releasing value, capacity value, and risk-adjusted value. Do not add them together when they describe the same mechanism.
Saved time is capacity. It becomes ROI only when the operating model converts it into revenue, avoided cost, or reduced risk.
Total Cost Is More Than the Model Bill
Production economics include:
- licenses, inference, retrieval, storage, and observability;
- data, identity, API, permission, and workflow integration;
- evaluation, regression testing, security, legal, privacy, and governance;
- human review, overrides, exception handling, and incident recovery;
- training, support, process redesign, and ongoing maintenance;
- the opportunity cost of engineering and domain experts.
Agentic systems make this especially important because reliability compounds. If each step succeeds independently 99% of the time, 20 steps yield about 82% end-to-end success; 50 steps yield about 61%. Real failures are not independent, so this is a design warning—not a forecast. More tool calls mean more retries, monitoring, and recovery.
KPMG's Q2 2026 pulse found 53% of surveyed leaders deploying agents, yet only 26% had real-time cost visibility. Deloitte's 2026 analysis found significant reported ROI remained uncommon and payback expectations often extended over several years. Agent ambition is outrunning agent accounting.
A Practical ROI Operating System
Replace the “launch, count users, declare success” pattern with six decisions.
| Decision | Minimum evidence |
|---|---|
| 1. Choose the workflow | A frequent, bounded unit of work; known owner; measurable constraint |
| 2. Name one value path | Save, scale, or innovate—plus the budget, demand, or margin mechanism |
| 3. Establish the baseline | Volume, end-to-end time, touch time, accepted quality, rework, escalation, and cost |
| 4. Run a fair comparison | Randomized cases where possible; otherwise matched contemporaneous cases |
| 5. Measure the whole system | Cost per accepted outcome, including review, retries, failures, and downstream effects |
| 6. Pre-commit the decision | Explicit thresholds for scale, redesign, or stop |
A strong primary metric is:
Guard it with material-error rate, escalation, user or customer experience, policy incidents, tail latency, and performance on difficult cases. Averages can conceal the highest-cost failures.
For every benefit, write the conversion mechanism:
| Operational change | Financial mechanism | Evidence |
|---|---|---|
| Lower handling time | Avoided hiring or more completed volume | Staffing plan or throughput records |
| Fewer errors | Lower rework, claims, penalties, or write-offs | Cost ledger and incident history |
| Faster approval | Earlier revenue or lower working capital | Billing and cash-cycle data |
| Higher conversion | Incremental contribution margin | Controlled conversion and margin |
| Less external work | Reduced BPO, agency, or contractor spend | Invoice and contract reduction |
If the mechanism cannot be named and owned, it is not ready for the ROI numerator.
A Worked Example: One Workflow, Two Answers
Consider an illustrative team handling 12,000 invoice exceptions a year. A controlled pilot safely routes 60% of cases and cuts touch time on those cases from 18 to 7 minutes.
| Annual economics | Amount |
|---|---|
| Released capacity: 1,320 hours × $48 | $63,360 |
| Reduced external services | $48,000 |
| Reduced rework | $24,000 |
| Total benefit if capacity is realized | $135,360 |
| Models and platform | ($35,000) |
| Annualized integration | ($30,000) |
| Evaluation and governance | ($20,000) |
| Human oversight | ($18,000) |
| Total cost | ($103,000) |
If the team uses that capacity to clear a growing backlog or avoid a planned hire, ROI is about 31%.
If the saved minutes become untracked slack, only $72,000 is cash-releasing and first-year cash ROI is about −30%.
The model did not change. The value-realization mechanism did.
The second answer does not automatically kill the project. It exposes the next decision: lower operating cost, expand eligible volume, reduce more external spend, connect capacity to demand—or stop claiming labor savings as cash.
The 90-Day Route to a Decision
For a bounded, high-volume workflow, use 90 days to answer a capital-allocation question—not to promise universal payback.
| Window | Outcome |
|---|---|
| Days 1–15 | Assign process and finance owners; define the unit, constraint, value path, metric, and gates. |
| Days 16–30 | Instrument the baseline; segment complexity; build evaluation cases; document controls. |
| Days 31–60 | Run a controlled pilot; capture review, overrides, retries, failures, and configuration versions. |
| Days 61–75 | Stress edge cases and volume; model production unit economics; test monitoring and rollback. |
| Days 76–90 | Scale if all gates pass, redesign a fixable constraint, or stop when economics or risk fails. |
The successful minority appears to do five things consistently: map capabilities to workflows, redesign the end-to-end process, improve the bottleneck, build evaluation and recovery as infrastructure, and give a business owner responsibility for the financial outcome. Most supporting enterprise evidence is observational, so treat these as testable design hypotheses rather than commandments.
Stopping is not failure. Continuing without evidence is.
Before approving scale, a steering committee should be able to answer seven questions:
- What unit of work becomes cheaper, faster, safer, or more valuable?
- Is it the binding constraint—or will output accumulate in another queue?
- What baseline and contemporaneous comparison support the claim?
- Is the value path save, scale, or innovate, and who owns it?
- Are integration, review, governance, failure, and change costs included?
- What happens to the hardest and highest-consequence cases?
- What evidence will make us scale, redesign, or stop?
The Bottom Line
The 95% claim is not a reliable market statistic. The enterprise value gap behind it is real.
Current evidence shows broad adoption, genuine but uneven task gains, limited measured firm impact, and returns concentrated among a small group of deeper adopters. It also shows why: organizations measure activity before workflow, capacity before realization, and model cost before system cost.
The emerging divide is not between firms that use AI and firms that do not. It is between shallow adopters generating activity and organizations building the workflows, data, controls, skills, and accountability required to convert capability into performance.
The winning question is not “How many people used the model?”
It is:
Did this workflow create more value than it cost—and should we scale it?
Sources and Further Reading
Firm-Level Adoption and Financial Impact
- NBER and Federal Reserve Bank of Atlanta: Firm Data on AI
- Federal Reserve Bank of Atlanta: Artificial Intelligence, Productivity, and the Workforce
- PwC: 29th Global CEO Survey
- Stanford HAI: 2026 AI Index—Economy
- BCG: AI Talk Is Cheap. Value Creation Is Rare
- Thompson et al.: AI Adoption in S&P 500 Firms
- McKinsey & Company: The State of AI in 2025
Causal and Workplace Evidence
- The Quarterly Journal of Economics: Generative AI at Work
- Management Science: The Effects of Generative AI on High-Skilled Work
- NBER: Shifting Work Patterns with Generative AI
- METR: The Impact of Early-2025 AI on Experienced Developer Productivity
- INSEAD and Harvard Business School: Mapping AI into Production
- He et al.: AI Writes Faster Than Humans Can Review
Enterprise Surveys and Implementation Signals
- Project NANDA: The GenAI Divide
- Wharton Human-AI Research and GBK Collective: 2025 AI Adoption Report
- Gallup: AI and Workplace Productivity in 2026
- BCG: How CEOs Scale AI Value
- KPMG: Global AI Pulse, Q2 2026
- Deloitte: AI Costs, Risk, and ROI
- Gartner: Why Half of GenAI Projects Fail
If your team is trying to turn an AI pilot into a measurable operating result, let's talk.