Mastering Observability in D365 F&O: A Complete Azure Application Insights Guide
If you've ever had a D365 Finance & Operations batch job silently fail at 2 AM, or watched a critical financial posting grind to a halt without any warning, you already understand why observability matters. The days of relying on Lifecycle Services (LCS) for reactive troubleshooting are coming to an end—Microsoft is deprecating legacy LCS monitoring features, and the future is Azure Application Insights.
This guide walks you through the full telemetry stack for Dynamics 365 Finance and Operations: from initial Azure resource provisioning through custom X++ metric development, KQL analytics, open-source community tooling, and automated alerting. By the end, your D365 environment will shift from reactive firefighting to proactive, data-driven operations.
Contents
Why Application Insights Changes Everything
Traditional D365 monitoring forced a dependency on Microsoft—support tickets, LCS environment logs, and limited visibility. Azure Application Insights flips this model completely.
Application Insights is a customer-owned telemetry pipeline. The data lands in your Azure subscription, in your Log Analytics workspace. You write the queries, you build the dashboards, you define what triggers an alert. Microsoft never sees this data unless you explicitly share it with them.
The capabilities this unlocks are significant:
- Live metric streams — watch incoming requests, error rates, and server response times as they happen
- Distributed tracing — correlate events across X++ code, batch processing, and external API integrations
- Dependency tracking — see exactly where database bottlenecks and external service slowdowns originate
- Custom telemetry — instrument any X++ business logic to emit the exact signal you need
This is the difference between knowing that something failed and knowing why, where, and when to fix it.
Architectural Configuration and Provisioning
Azure Resource Setup
Every solid observability implementation starts with the right Azure foundation. Modern Application Insights deployments must be workspace-based, routing all telemetry to a unified Azure Log Analytics workspace.
The workspace-based architecture provides two critical benefits:
- All application logs, infrastructure metrics, and platform diagnostics land in one place—enabling cross-resource KQL queries
- Azure RBAC applies uniformly across your entire diagnostic estate, eliminating complex cross-workspace access management
A critical best practice: deploy a separate Application Insights resource for each environment tier — Development, Sandbox, and Production. Mixing telemetry across environments pollutes your production baselines with erratic testing data and makes anomaly detection unreliable.
Enabling Telemetry in D365 F&O
With the Azure resource provisioned, you need to activate and configure telemetry within D365 itself. The process has three steps:
Step 1 — Enable the feature Navigate to Feature Management, find the Monitoring and Telemetry feature, and enable it.
Step 2 — Configure environments Go to System administration → Setup → Monitoring and Telemetry parameters. On the Environments tab, create a record for each environment that should emit telemetry, specifying an Environment ID and Environment Mode (Development, Test, or Production).
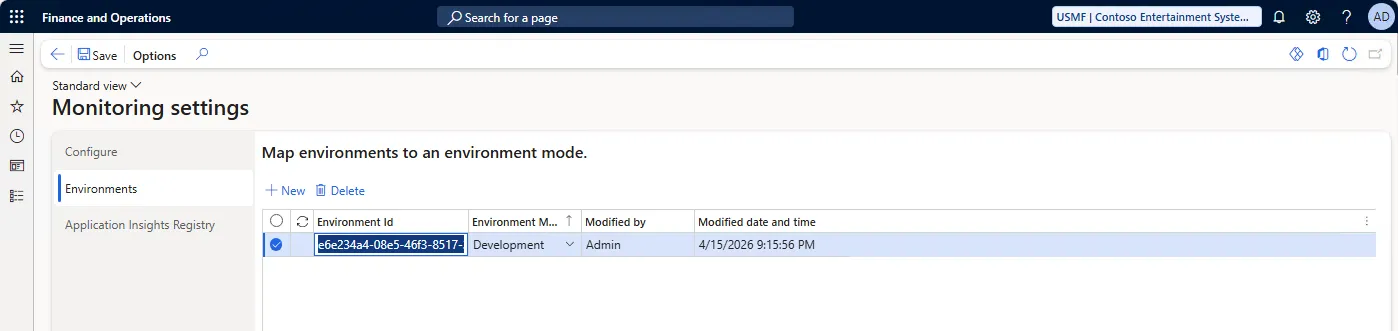
💡 Pro tip: Store all environment configurations in the same database. When you do a production-to-sandbox database refresh, the telemetry mappings survive the copy instead of being overwritten.
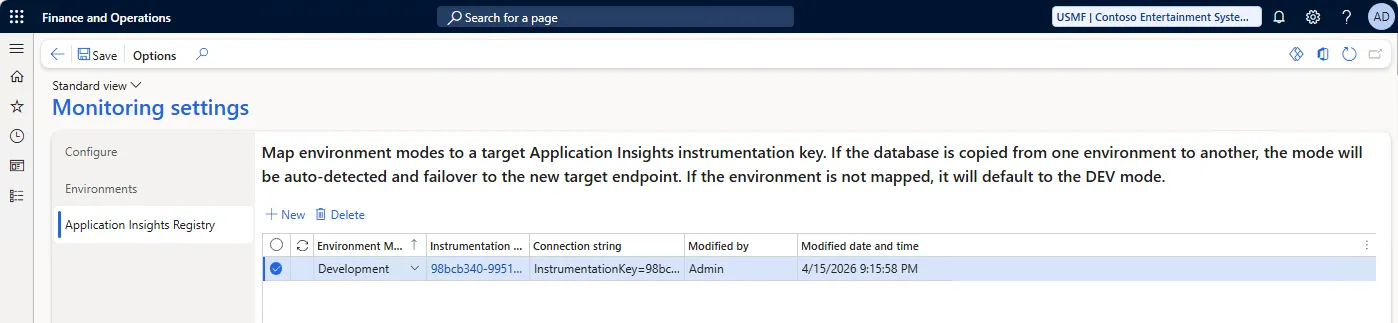
Step 3 — Register your Application Insights resource On the Application Insights Registry tab, map each Environment Mode to its corresponding Application Insights resource using the Connection String — not the legacy Instrumentation Key. Connection Strings are required for Azure Monitor OpenTelemetry compatibility, are more resilient to network fluctuations, and remove dependence on global ingestion endpoints.
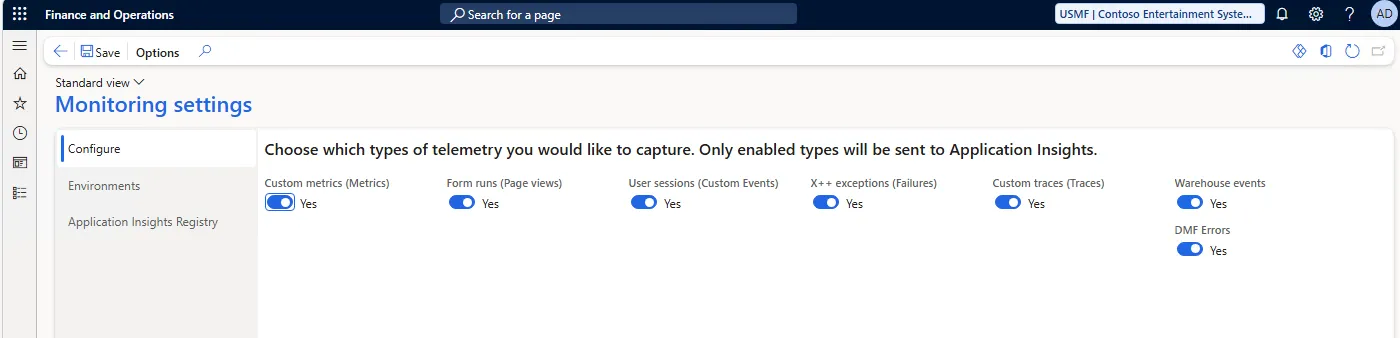
Step 4 — Configure telemetry categories
The Configure tab lets you toggle specific telemetry categories: page views, trace exceptions, batch events, and more. Use this granular control to balance diagnostic coverage against Log Analytics ingestion costs.
Out-of-the-Box Telemetry Signals
Once configured, D365 emits a surprisingly rich set of native telemetry with zero custom code required.
Form Load and User Interaction Telemetry
Every form access generates a pageViews telemetry event, capturing:
- Which form was opened
- Which user opened it
- Exact load duration in milliseconds
This data lets you calculate P95 load times, track long-term usage patterns, and identify navigation bottlenecks before users start complaining. If a form consistently loads in 8 seconds for some users but 1 second for others, this data tells you exactly where to look.
X++ Exception Monitoring
All exceptions originating in X++ code stream directly to the Application Insights exceptions table. This enables:
- Detection of recurring code failures before they cascade
- Trend analysis that exposes systemic degradation weeks before an outage
- Priority-based bug fix queues backed by empirical exception frequency data
Data Management Framework (DMF) Diagnostics
DMF errors land in the customEvents table, each tagged with a specific error code. Here are some of the most common codes you'll encounter and what they mean:
| Error Code | What It Means | How to Fix It |
|---|---|---|
| Import Update Conflicts | Parallel threads updating the same record | Enable sequential processing or deduplicate source files |
| Unmapped Fields | Fixed-width template exported without header row | Re-export template with "First row header" enabled |
| Download ID Not Found | File in source blob storage, inaccessible from target | Ensure target environment points to correct blob storage |
| HRESULT: 0xC0010009 | XML mapping exists for a column absent from the file | Audit column mappings against actual file structure |
| DMF021 | Missing enumeration value mappings | Fix enum value mappings in data entity architecture |
| DMF023 | Database connection timeout (often during patching) | Retry after deployment window; check BYOD connectivity |
| DMF1957 | Encoding conflict on Unicode data exported as ASCII | Switch export format to UTF-8 compatible type |
Having these error codes in telemetry means you can alert on DMF023 automatically, correlating it with deployment windows and notifying your data engineering team before they even notice the failure.
Batch Processing Telemetry
Batch observability requires enabling specific feature flights:
BatchTelemetryConfigurationFlightBatchThreadInfoTelemetryFlightBatchTelemetryCallstackFlight
With these active, your batch telemetry includes:
- Precise start/stop timestamps — millisecond-level duration tracking per job
- Throttling events — captures CPU utilization, available memory, and DTU consumption when throttling activates
- Thread availability — exposes active thread counts across all AOS instances, enabling diagnosis of thread starvation
- Queue depth — tracks queue sizes in the priority-based scheduling framework
- Failure call stacks — when a batch task fails, the full X++ call stack is captured and correlated to the job
Thread starvation is one of the most common causes of "stuck" batch jobs. With thread telemetry, you can see immediately whether a job isn't running because of a code problem or simply because all threads are occupied.
Warehouse Management Telemetry
For Supply Chain Management implementations, the warehouse module emits custom events that distinguish between:
- Tenant-side operations — core SCM server telemetry
- Mobile device operations — telemetry from the Warehouse Management mobile app
The mobile app telemetry is especially valuable for diagnosing scanning latency experienced by floor workers on patchy Wi-Fi, or identifying performance regressions introduced by device OS updates.
Warehouse Mobile App Client Round Trip Events
The Warehouse.MobileApp.ClientRoundTrip event (eventId: WHS000006) is the most precise signal for diagnosing real-world warehouse scanning performance. Emitted on every mobile app interaction (Warehouse Management mobile app version 2.0.28+), it captures a full latency breakdown across three distinct phases:
| Dimension | What It Captures |
|---|---|
roundTripLatencyDurationInMilliseconds |
Total time from scan to response — what floor workers actually experience |
backendProcessingTime |
Server-side processing time only |
renderingDurationInMilliseconds |
Time spent rendering the response on the device |
wifiSignalStrength |
Wi-Fi signal strength at time of scan (v2.1.12+) |
networkConnectionProfiles |
Active network profile — Wi-Fi, cellular, etc. (v2.1.12+) |
networkAccess |
Network access type (v2.1.12+) |
lastKnownWMSLocation |
Physical warehouse location of the scanning device (v2.1.12+) |
lastKnownWarehouse |
Warehouse code (v2.1.19+) |
The core diagnostic formula: network latency = roundTripLatencyDurationInMilliseconds − backendProcessingTime − renderingDurationInMilliseconds. When that delta is elevated for a specific lastKnownWMSLocation but normal everywhere else, you have a Wi-Fi dead zone — not a server problem, not a code problem, a coverage gap in a specific aisle, dock, or cold-storage area.
This transforms vague complaints into actionable evidence. Instead of a floor supervisor anecdotally reporting "scanning feels slow near cold storage", you have empirical proof that devices at COLD-ZONE-03 average 2,400ms round trips versus 340ms in the main receiving bay — with corroborating wifiSignalStrength readings to confirm the root cause before dispatching a networking team.
Developing Custom X++ Telemetry
Out-of-the-box telemetry covers the platform—but your business logic is unique. Custom telemetry lets you monitor exactly the metrics that matter for your implementation.
The SysApplicationInsightsTelemetryLogger
D365 provides the SysApplicationInsightsTelemetryLogger X++ class as a performant wrapper around the native Application Insights client. It uses the static constructor pattern, maintaining a single logger instance per AOS server to minimize memory overhead and reduce emission latency.
Custom Events
To track custom business events, follow the OOB pattern: define typed property classes extending SysApplicationInsightsProperty. This provides type safety, compliance classification, and consistent naming across your telemetry estate.
Step 1 — Define your property classes
/// <summary>
/// Property class for integration identifier
/// </summary>
internal final class TDGApplicationInsightsIntegrationIdProperty extends SysApplicationInsightsProperty
{
    internal static TDGApplicationInsightsIntegrationIdProperty newFromValue(str _value)
    {
        return new TDGApplicationInsightsIntegrationIdProperty(_value);
    }

    protected container initialize()
    {
        return TDGApplicationInsightsProperties::IntegrationId;
    }
}

/// <summary>
/// Property class for integration status
/// </summary>
internal final class TDGApplicationInsightsIntegrationStatusProperty extends SysApplicationInsightsProperty
{
    internal static TDGApplicationInsightsIntegrationStatusProperty newFromValue(str _value)
    {
        return new TDGApplicationInsightsIntegrationStatusProperty(_value);
    }

    protected container initialize()
    {
        return TDGApplicationInsightsProperties::IntegrationStatus;
    }
}

/// <summary>
/// Property class for integration endpoint
/// </summary>
internal final class TDGApplicationInsightsIntegrationEndpointProperty extends SysApplicationInsightsProperty
{
    internal static TDGApplicationInsightsIntegrationEndpointProperty newFromValue(str _value)
    {
        return new TDGApplicationInsightsIntegrationEndpointProperty(_value);
    }

    protected container initialize()
    {
        return TDGApplicationInsightsProperties::IntegrationEndpoint;
    }
}

/// <summary>
/// Property class for record count
/// </summary>
internal final class TDGApplicationInsightsRecordCountProperty extends SysApplicationInsightsProperty
{
    internal static TDGApplicationInsightsRecordCountProperty newFromValue(str _value)
    {
        return new TDGApplicationInsightsRecordCountProperty(_value);
    }

    protected container initialize()
    {
        return TDGApplicationInsightsProperties::RecordCount;
    }
}

/// <summary>
/// Property class for duration in milliseconds
/// </summary>
internal final class TDGApplicationInsightsDurationMsProperty extends SysApplicationInsightsProperty
{
    internal static TDGApplicationInsightsDurationMsProperty newFromValue(str _value)
    {
        return new TDGApplicationInsightsDurationMsProperty(_value);
    }

    protected container initialize()
    {
        return TDGApplicationInsightsProperties::DurationMs;
    }
}
Step 2 — Define your properties catalog with compliance classification
/// <summary>
/// Contains all custom TDG event properties for Application Insights telemetry.
/// </summary>
/// <remarks>
/// Property names must be unique and sorted alphabetically.
/// Compliance classification determines data handling requirements.
/// </remarks>
static final class TDGApplicationInsightsProperties
{
    internal static const container IntegrationId           = ['tdgIntegrationId',        SysApplicationInsightsComplianceDataType::CustomerContent];
    internal static const container IntegrationStatus       = ['tdgIntegrationStatus',    SysApplicationInsightsComplianceDataType::CustomerContent];
    internal static const container IntegrationEndpoint     = ['tdgIntegrationEndpoint',  SysApplicationInsightsComplianceDataType::CustomerContent];
    internal static const container RecordCount             = ['tdgRecordCount',          SysApplicationInsightsComplianceDataType::CustomerContent];
    internal static const container DurationMs              = ['tdgDurationMs',           SysApplicationInsightsComplianceDataType::CustomerContent];
}
Step 3 — Emit telemetry with proper error handling
/// <summary>
/// Tracks integration lifecycle with start/end events and error callstack capture
/// </summary>
public void executeIntegration(str _integrationId, str _endpoint)
{
    SysApplicationInsightsTelemetryLogger logger = SysApplicationInsightsTelemetryLogger::instance();
    utcDateTime startTime = DateTimeUtil::utcNow();
    int recordCount = 0;

    // Track integration start
    SysApplicationInsightsEventTelemetry startEvent =
        SysApplicationInsightsEventTelemetry::newFromEventIdName('TDG001', 'IntegrationStart');
    startEvent.addProperty(TDGApplicationInsightsIntegrationIdProperty::newFromValue(_integrationId));
    startEvent.addProperty(TDGApplicationInsightsIntegrationEndpointProperty::newFromValue(_endpoint));
    // Additional integration payload specific properties can be added.
    logger.trackEvent(startEvent);

    try
    {
        // Execute integration logic
        recordCount = this.processRecords(_endpoint);

        // Track successful completion
        SysApplicationInsightsEventTelemetry endEvent =
            SysApplicationInsightsEventTelemetry::newFromEventIdName('TDG002', 'IntegrationEnd');
        endEvent.addProperty(TDGApplicationInsightsIntegrationIdProperty::newFromValue(_integrationId));
        endEvent.addProperty(TDGApplicationInsightsIntegrationStatusProperty::newFromValue('Success'));
        endEvent.addProperty(TDGApplicationInsightsRecordCountProperty::newFromValue(int2Str(recordCount)));
        // Additional integration payload specific properties can be added.
        endEvent.addProperty(TDGApplicationInsightsDurationMsProperty::newFromValue(
            int642Str(DateTimeUtil::getDifference(DateTimeUtil::utcNow(), startTime))
        ));
        logger.trackEvent(endEvent);
    }
    catch (Exception::Error)
    {
        // Track failure with full callstack
        SysApplicationInsightsEventTelemetry failureEvent =
            SysApplicationInsightsEventTelemetry::newFromEventIdName('TDG002', 'IntegrationEnd');
        failureEvent.addProperty(TDGApplicationInsightsIntegrationIdProperty::newFromValue(_integrationId));
        failureEvent.addProperty(TDGApplicationInsightsIntegrationStatusProperty::newFromValue('Failed'));
        failureEvent.addProperty(SysApplicationInsightsCallStackProperty::newFromCurrentCallStack());
        failureEvent.addProperty(TDGApplicationInsightsDurationMsProperty::newFromValue(
            int642Str(DateTimeUtil::getDifference(DateTimeUtil::utcNow(), startTime))
        ));
        logger.trackEvent(failureEvent);

        throw;
    }
}
The typed property pattern provides several advantages:
- Compile-time validation — typos in property names break the build instead of corrupting telemetry
- Compliance classification —
CustomerContentvs.OIIdesignation drives data residency and retention policies - Refactoring safety — renaming a property updates all usages automatically
- Discoverability — IntelliSense exposes all available properties in the
TDGApplicationInsightsPropertiescatalog
Query these events in KQL to calculate integration success rates and identify failing endpoints:
customEvents
| where name in ("IntegrationStart", "IntegrationEnd")
| extend
    integrationId = tostring(customDimensions.tdgIntegrationId),
    status = tostring(customDimensions.tdgIntegrationStatus),
    endpoint = tostring(customDimensions.tdgIntegrationEndpoint),
    callstack = tostring(customDimensions.Callstack)
| summarize
    starts = countif(name == "IntegrationStart"),
    successes = countif(status == "Success"),
    failures = countif(status == "Failed"),
    failureCallstacks = make_set_if(callstack, status == "Failed")
    by integrationId, endpoint
| extend successRate = todouble(successes) / todouble(starts) * 100
| order by successRate asc
Custom Metrics with Local Preaggregation
Metrics track continuous states — queue depths, pending journal counts, active sessions. The trackMetric and trackMetricWithDimensions methods use local preaggregation to prevent telemetry from impacting ERP performance:
- When
trackMetricis called, the value is updated in local AOS memory — no HTTP request fires - Every 60 seconds, the accumulated batch transmits to Azure
This is essential for high-frequency metric updates in batch processing scenarios where thousands of updates per minute would otherwise saturate the Application Insights endpoint.
Telemetry Type Reference
| Telemetry Type | X++ Class | Best Used For |
|---|---|---|
| Custom Events | SysApplicationInsightsEventTelemetry |
Business process completions, state transitions |
| Page Views | PageViewTelemetry |
Form load tracking, UX performance |
| Exceptions | ExceptionTelemetry |
Unhandled errors with full call stack context |
| Trace Logs | TraceTelemetry |
Diagnostic messages replacing legacy infolog |
Advanced Analytics with KQL
With telemetry flowing into Log Analytics, Kusto Query Language (KQL) becomes your analytical superpower.
Table Naming: Application Insights vs. Log Analytics
The table names differ depending on where you're querying:
| Telemetry Type | Application Insights Table | Log Analytics Table |
|---|---|---|
| Logs | traces |
AppTraces |
| Form Loads | pageViews |
AppPageViews |
| X++ Errors | exceptions |
AppExceptions |
| Custom/Batch/DMF | customEvents |
AppEvents |
| Metrics | customMetrics |
AppMetrics |
Form Performance Analysis
This query identifies your slowest forms and quantifies the user experience impact:
pageViews
| where timestamp > ago(7d)
| where duration > 0
| extend activityId = tostring(customDimensions["ActivityId"])
| summarize
    executions = count(),
    avgDuration = avg(duration) / 1000,
    minDuration = min(duration) / 1000,
    maxDuration = max(duration) / 1000,
    p95Duration = percentile(duration, 95) / 1000
    by name
| order by p95Duration desc
This gives you the empirical evidence needed to justify refactoring specific X++ form extensions or adjusting database indexes on high-traffic forms.
Batch Thread Exhaustion Detection
This query diagnoses whether batch jobs are stuck due to code failures or infrastructure capacity:
customEvents
| where name == "BatchThreadInfo"
| extend info = parse_json(tostring(customDimensions["InfoMessage"]))
| project
    timestamp,
    CurrentBatchTasks = toint(info.CurrentBatchTasks),
    MaxThreadCount = toint(info.MaxThreadCount),
    ReservedThreads = toint(info.ReservedNumberOfThreads)
| extend AvailableThreads = MaxThreadCount - CurrentBatchTasks - ReservedThreads
| render timechart
Plot this on a dashboard and thread starvation becomes immediately visible — spikes where AvailableThreads drops to zero explain why jobs sit in the queue without executing.
Warehouse Mobile App Latency Analysis
The WHS000006 ClientRoundTrip event enables precise decomposition of scanning performance by physical warehouse location. This query separates the network cost from server and rendering costs, surfacing exactly which zones need Wi-Fi attention:
// Isolate network vs. server vs. rendering latency by warehouse zone
customEvents
| where timestamp > ago(7d)
| where customDimensions.eventId == 'WHS000006'
| extend
    roundTripMs  = tolong(customDimensions.roundTripLatencyDurationInMilliseconds),
    backendMs    = tolong(customDimensions.backendProcessingTime),
    renderMs     = tolong(customDimensions.renderingDurationInMilliseconds),
    wmsLocation  = tostring(customDimensions.lastKnownWMSLocation),
    warehouse    = tostring(customDimensions.lastKnownWarehouse),
    wifiStrength = tostring(customDimensions.wifiSignalStrength),
    deviceId     = tostring(customDimensions.deviceId)
| extend networkLatencyMs = roundTripMs - backendMs - renderMs
| summarize
    avgRoundTripMs  = avg(roundTripMs),
    p95RoundTripMs  = percentile(roundTripMs, 95),
    avgNetworkMs    = avg(networkLatencyMs),
    avgBackendMs    = avg(backendMs),
    scanCount       = count()
    by wmsLocation, warehouse
| order by p95RoundTripMs desc
When avgNetworkMs is high for a specific wmsLocation while avgBackendMs remains consistent across locations, the bottleneck is infrastructure — not application code. Cross-reference with wifiSignalStrength to confirm signal correlation before escalating to your network team. For environments with mobile app version 2.1.12+, you can additionally group by networkConnectionProfiles to identify whether devices are falling back to cellular — a common problem in large distribution centres with inconsistent Wi-Fi coverage near loading docks.
Open-Source Community Tools
You don't need to build everything from scratch. The Dynamics 365 community and Microsoft FastTrack teams maintain excellent open-source resources.
Microsoft FastTrack FSCM Telemetry Samples
The Dynamics-365-FastTrack-FSCM-Telemetry-Samples repository is the authoritative starting point. It includes:
- Forms Telemetry Dashboard — plug-and-play visualization of form rendering metrics
- X++ Errors Dashboard — correlates application exceptions for holistic stability monitoring
- Batch Monitoring Dashboard ADE-Dashboard-D365FO-Monitoring-Batch.json — import this JSON into Azure Data Explorer to instantly visualize batch start/stop times, failure call stacks, and thread availability
Best practice: deploy these dashboards to your sandbox first, validate that visualizations align with your data model, then promote to production.
ISM Telemetry Framework
The ISM-Telemetry-for-Finance-and-Operations framework provides a streamlined library that simplifies custom telemetry emission.
The key innovation is ISMTelemetryGeneric, which uses the addRuntimeProperty method to inject key-value pairs directly into customDimensions without manual .NET data contract instantiation:
ISMTelemetryGeneric telemetry = ISMTelemetryGeneric::construct('CustomReport');
telemetry.addRuntimeProperty('ReportName', reportName);
telemetry.addRuntimeProperty('ParameterCount', int2Str(paramCount));
telemetry.processEvent(); // dispatches async, includes auto-captured duration
The framework also ships with pre-built modules for:
- DMF import/export analytics
- Excel export performance tracking
- Business Event execution monitoring
- Dual-write synchronization state tracking
Supply Chain Management KQL Scripts
The d365-scm-telemetry repository provides warehouse-specific KQL scripts:
WarehouseManagement.kql— tenant-side operations analysisWarehouseMobileApp.kql— device-side interaction diagnostics
These scripts can be embedded directly into Power BI for real-time operational scorecards delivered to warehouse facility managers.
Alerting: From Passive to Proactive
Dashboards tell you what happened. Alerts tell you what's happening right now.
Designing KQL-Based Alerts
Azure Monitor lets you define alert rules backed by KQL queries that continuously evaluate your telemetry stream. Common high-value alert scenarios for D365:
Security alert — sensitive data modification
customEvents
| where name == "EntityUpdate"
| where tostring(customDimensions["EntityName"]) == "VendBankAccount"
| where timestamp > ago(5m)
| summarize count() by bin(timestamp, 5m)
| where count_ > 0
Trigger a high-severity alert if a vendor bank account record is modified outside of normal business hours.
Batch failure with call stack
customEvents
| where name == "BatchFailure"
| where timestamp > ago(15m)
| extend jobName = tostring(customDimensions["BatchJobName"])
| where jobName in ("LedgerJournalPost", "MasterScheduling")
Alert immediately on failures for critical financial batch jobs, with the full call stack in the alert payload.
Form performance degradation
pageViews
| where timestamp > ago(1h)
| where name contains "LedgerJournal"
| summarize p95 = percentile(duration, 95) by bin(timestamp, 10m)
| where p95 > 10000 // alert if P95 exceeds 10 seconds
Alert Implementation Pattern
- Create an Action Group — define whether to email, SMS, invoke a Webhook, or trigger an Azure Logic App
- Define a KQL condition — the query that evaluates your telemetry stream
- Set thresholds — use dynamic thresholds where mathematical baselines are appropriate
- Configure suppression — add alert processing rules to suppress notifications during planned maintenance windows
The most important operational discipline: avoid alert fatigue. A well-designed alert rule that covers multiple environments is better than dozens of individual rules with marginally different thresholds.
Closed-Loop Automation with REST APIs
For sophisticated implementations, combine the Application Insights Data Access REST API with D365's OData endpoints to create fully automated incident response:
- Azure Data Factory triggers a DMF import via the Package REST API
- The import fails; failure context is emitted to Application Insights
customEvents - An Azure Logic App queries the Application Insights API using the correlated activity ID
- The Logic App retrieves the precise XML formatting error from
customDimensions - The enriched diagnostic data is automatically injected into a ServiceNow incident ticket
No manual log hunting. No ticket back-and-forth. The on-call engineer opens the ticket and immediately sees exactly which column mapping failed and why.
Strategic Deployment Lifecycle
Design Phase
- Identify KPIs and map alert notification pathways
- Establish data retention policies to control Log Analytics costs
- Plan environment segregation (Dev / Sandbox / Production = separate App Insights resources)
Pre-Go-Live Validation
- Configure and validate all KQL queries and dashboards in Sandbox
- Enable Azure availability tests to simulate peak load
- Validate that custom X++ telemetry emits correct
customDimensionspayloads - Test that alerts fire on simulated failure conditions
Post-Go-Live Operations
- Monitor live metric streams during go-live cutover
- Audit sampling rates weekly — high-volume trace data can inflate costs significantly
- Investigate recurring patterns proactively (e.g., CPU spikes during nightly batch runs = add indexing before the next month-end close)
- Connect Application Insights to Azure Data Explorer for cross-service queries that correlate ERP telemetry with IoT sensor data, Power Platform diagnostics, or external API gateways
Key Takeaways
Achieving enterprise-grade observability in Dynamics 365 F&O is not a one-time configuration—it's an architectural capability that compounds in value over time. Here's what to remember:
- Use Connection Strings, not Instrumentation Keys — they're required for OpenTelemetry compatibility
- Separate App Insights resources per environment — never mix Dev/Test/Prod telemetry
- Store all environment configs in one database — survive database refreshes without losing mappings
- Enable batch flight features —
BatchTelemetryConfigurationFlightunlocks thread and queue depth visibility - Use local preaggregation for high-frequency metrics —
trackMetricbatches locally before transmitting - Start with FastTrack community dashboards — don't build what already exists
- Design alerts with suppression rules — protect your team from alert fatigue
- Build closed-loop automation — combine Application Insights API + Logic Apps for self-healing pipelines
The investment in proper telemetry architecture pays back the first time a critical batch failure is caught and auto-resolved before anyone notices. Then it pays back again every month-end close, every major deployment, and every time a performance regression surfaces in metrics before it reaches your users.
Get in Touch
Need help implementing Application Insights telemetry for your D365 F&O environment? Want to discuss custom X++ instrumentation, KQL dashboard design, or building proactive alerting pipelines?
Connect with me:
- 📧 Email: [email protected]
- 🐦 Twitter/X: @TheDataGuyPro
- 💼 LinkedIn: Muhammad Afzaal
- 💻 GitHub: @mafzaal
- 🎥 YouTube: @TheDataGuyPro
- 🎧 Podcast: TheDataGuy Show
Whether you're looking for consulting services, training, or just want to discuss D365 F&O observability strategies, I'd love to hear from you!